
High-Tech Diagnostic Tools
Learn how these advanced three-dimensional imaging modalities can improve diagnostic capabilities and support treatment planning in the dental setting.
Recent advances to hardware and software provide oral health professionals with the tools they need for improved patient diagnostics and outcomes. Advanced three-dimensional (3D) imaging modalities can help clinicians in the diagnosis of maxillofacial pathology, as well as supplement surgical treatment planning. Diagnostic imaging tools also reduce patient risk by improving the visual accuracy of images, thus supporting the clinician’s ability to make an accurate diagnosis. Implementing radiology diagnostic tools and their software can also assist oral health professionals in the early detection of oral anomalies.
ADVANCED IMAGING TOOLS
Cone-beam computed tomography (CBCT) is a superior diagnostic tool that uses the universal imaging format—digital imaging and communications in medicine, or DICOM. This allows clinicians to use software to view areas of interest in other planes, in addition to gray-scale values.1
Interactive diagnostic imaging is a new software technology used in maxillofacial diagnosis. It derives from medical imaging and is primarily used in CT and magnetic resonance imaging. The term “3D advanced visualization technique” is used for this type of image data manipulation.
The information stored in a CBCT scan can be used to display reformatted images of different anatomical planes to aid in diagnosis. Current digital interactive software offers the ability for multi-planar imaging and reformatting. Other enhancements include zoom, magnification, annotation, and window/leveling—which enables practitioners to manipulate an image’s gray scales.2
IMAGING RECONSTRUCTION TECHNIQUES
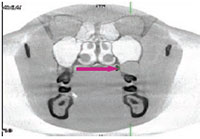
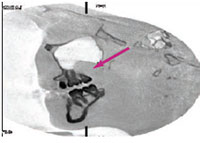
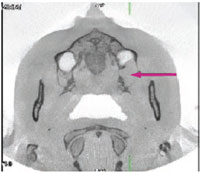
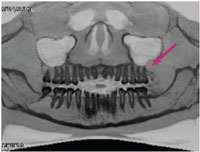
In order to provide these types of diagnostic images, a practice needs a CBCT machine and advanced 3D visualization software. Multi-planar imaging is the standard 3D imaging mode offered by most advanced imaging software programs. It can be used to view images in the coronal, sagittal, and axial planes throughout the volume set. Figure 1 to Figure 3 demonstrate the three planes with the window/leveling inverted to display the dental anatomy in great detail.
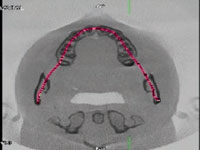
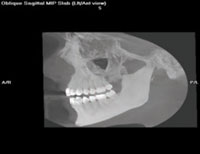
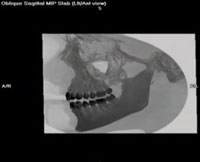
A curved plane reformat image can also be created along the curve of the maxilla or mandible on the axial plane image to display the volume set in a panoramic view. The curve can be adjusted specifically to the patient’s maxilla or mandible, providing more accurate detail when creating a panoramic projection (Figure 4 and Figure 5).
ADDITIONAL TOOLS
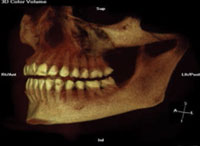
Segmentation is another feature that enables clinicians to extract or isolate certain structures in the 3D model. This tool is useful in diagnosis and treatment planning because superficial structures (eg, soft tissue) that may inhibit the ability to visualize the area of interest can be removed. In addition to segmentation, color rendering can be used to highlight different brightness/gray-scale values. This is similar to attenuation values called Hounsfield units in medical CT (Figure 6).3
Surface-shaded display (SSD) and maximum intensity pixels (MIP) are also valuable software tools that can aid oral health professionals in diagnosis and treatment planning. SSD provides an overall view of anatomical structures and surface morphology that can be manipulated and viewed at different angles. This technique is useful for looking at the alignment of the maxilla and mandible in the anterior-to-posterior position, and also the alignment along the left and right lateral margins of the maxilla and mandible. MIP displays only the brightness voxel values within the data set. This tool can remove all superficial structures that may be superimposed over the bony anatomy (Figure 7). 4 An inverted MIP projection that provides a reversed gray-scale view of the anatomical structures is seen in Figure 8. Some CBCT software may not have the ability to perform these advanced 3D and interactive features. Third-party advanced visualization software should be considered in order to improve diagnostic accuracy.
CASE STUDY
A 23-year-old woman visited her dental practice complaining of “squishy” gum tissue associated with the maxillary left third molar region. The patient did not have any noted facial asymmetry. Her second molars had been removed for orthodontic reasons, and her third molars had been orthodontically guided into the second molar position. The patient was compliant with her recare schedule and was in good oral health.
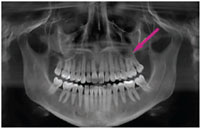
The patient expressed pain in the maxillary left third molar region and said she was able to drain the swollen area with digital pressure. An oral exam revealed an expansile purulent lesion approximately 14 mm in diameter superior and distal to the maxillary left third molar. A panoramic radiograph revealed a radiolucency superior and distal to #16 (Figure 9). The lesion appeared to be extending into the sinus.
Determining the cause of this radiolucency was difficult to ascertain on the panoramic X-ray, so CBCT scans were taken. The scans demonstrate the three planes with the window/leveling inverted to display the dental anatomy in greater detail (Figure 1 through Figure 3). The red arrows show the purulent lesion. These additional views clearly outline the cystic lesion in three different planes, as well as the reconstructed panoramic view. The data provided by the scans provide better orientation of the lesion to the surrounding anatomical structures.
The clinical history and images were submitted to an oral pathology laboratory that described the lesion as a 2 cm unilocular cyst posterior to #16 in the maxilla. The differential diagnosis, which is the process of distinguishing between two or more conditions that share similar signs and symptoms, was based on the patient’s history, radiographs, and clinical examination. Through an evaluation of the available data, the differential diagnosis was a radicular cyst or a dentigerous cyst. The histological exam—a microscopic examination of the cells and tissues—conclusively indicated the lesion was a keratocystic odontogenic tumor. With additional utilization of CBCT radiology, the precise location was noted, and the tumor was surgically excised with little trauma to the surrounding tissue.
CONCLUSION
This case study illustrates how advanced 3D visualization software is a valuable addition to the dental practice for the diagnosis of dental pathology and enhanced treatment planning. Diagnostic imaging provides clinicians with additional dynamic tools that manipulate the image data and visualize specific anatomical areas. The ability to manipulate image gray scales and anatomical planes using sophisticated software assists the dental practitioner in achieving optimal patient outcomes.
REFERENCES
- Dreyer KJ, Hirschorn DS, Thrall JH, Mehta A. PACS: A Guide to the Digital Revolution. 2nd ed. New York: Springer Science+Business Media Inc; 2006:447–451.
- Scarfe WC, Farman AG, Sukovic P. Clinical applications of cone-beam computed tomography in dental practice. J Can Dent Assoc. 2006;72f:75?80.
- Seeram E. Computed Tomography: Physical Principles, Clinical Applications, and Quality Control. 3rd ed. St, Louis: Saunders Elsevier; 2009:94?95.
- Angelopoulos C, Aghaloo T. Imaging technology in implant diagnosis. Dent Clin North Am. 2011;55:141?158.
From Dimensions of Dental Hygiene. April 2014;12(4):16,18–19.
